IQ Tests; Intelligence Quotient and Society
I remember doing an IQ test back in grade school (I think it was grade 3 or 4). I don’t recall the results nor was I given them :(, but I was recommended for the “Gifted Program” at that time – I guess I didn’t score too badly then. (The program was actually quite boring and made me spend a day away from my regular classes so eventually I dropped the program.) Since then, I’ve been amused by the subject of the IQ test. It’s been criticized by people who claim it tests only a specific type of intelligence and therefore is not accurate. However, as long as you are measuring the results derived out of the same test that is given, it can give a general sense of level of intelligence. Out of curiosity, I did two different IQ tests online.
The first one I did at iqtest.com gave me:
“Your general IQ score is: 133”
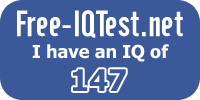
A second test I did gave me a different score.

Free-IQTest.net – Free IQ Tests
Hm.. wonder why the tests scored so differently??
Both tests use the same “intelligence interval” to give you a “cognitive designation”. (The table and graph below are from free-iqtest.net’s IQ test score guide.)
Intelligence Interval Cognitive Designation
40 – 54 Severely challenged (Less than 1% of test takers)
55 – 69 Challenged (2.3% of test takers)
70 – 84 Below average
85 – 114 Average (68% of test takers)
115 – 129 Above average
130 – 144 Gifted (2.3% of test takers)
145 – 159 Genius (Less than 1% of test takers)
160 – 175 Extraordinary genius

The IQ graph above is interesting. It shows the percentage of test takers falling into each category. Based on the graph, 95.4% score between 70 and 130. Only 2.23% score 130 and above. This also means that 2.37% of test takers score less than 70.
The implications from this are astounding and something I’ve thought about before. Based on the IQ graph, test takers who score 130 or above are less likely to meet people just as intelligent as themselves – it works out to 1.115 person out of 50 (or just 1 person out of 50 since we can’t divide people into portions). This can be quite frustrating for those people scoring 130 and above who wish to find intelligent peers.
Another implication based on the IQ graph is that an average intelligent person (IQ 85 to 114) is about as likely to meet someone of high intelligence (IQ 130 and above) as someone who is challenged (IQ below 70). Because an average intelligent person may not understand someone who is of high intelligence, the person of average intelligence may just well conclude that the person who is “gifted” or a “genius” is below average intelligence.
Furthermore, decisions based on the majority of the population won’t necessarily be the smartest or wisest decision. As mentioned, someone of average intelligence may not understand something as well as someone of high intelligence and, therefore, may not agree with the decision of the person (or people) of high intelligence although it may very well be the most intelligent decision! In a democratic society, this has some serious implications, not the least being the alienation of the more intelligent people in the society due to “tyranny of the majority”1. Since people of average intelligence are the majority (68.2%), someone of average intelligence will often assume they are more correct than someone of high intelligence simply because of the majority. This is, according to the IQ graph and IQ testing, an incorrect assumption to make. Many people of average intelligence will not make a group of high intelligence – that’s just not logically possible. In politics, when voting for a leader in a democratic society, the leader voted in is not necessarily the best candidate or smartest choice. Thus, a democratic society in the long term is unlikely to ever be a highly intelligent society.
Notes:
1. John Stuart Mill’s essay “On Liberty” (excerpt located at http://64.233.161.104/search?q=cache:CKnG_hyk6ggJ:www.serendipity.li/jsmill/
jsmill.htm+%22tyranny+of+the+majority%22&hl=en
